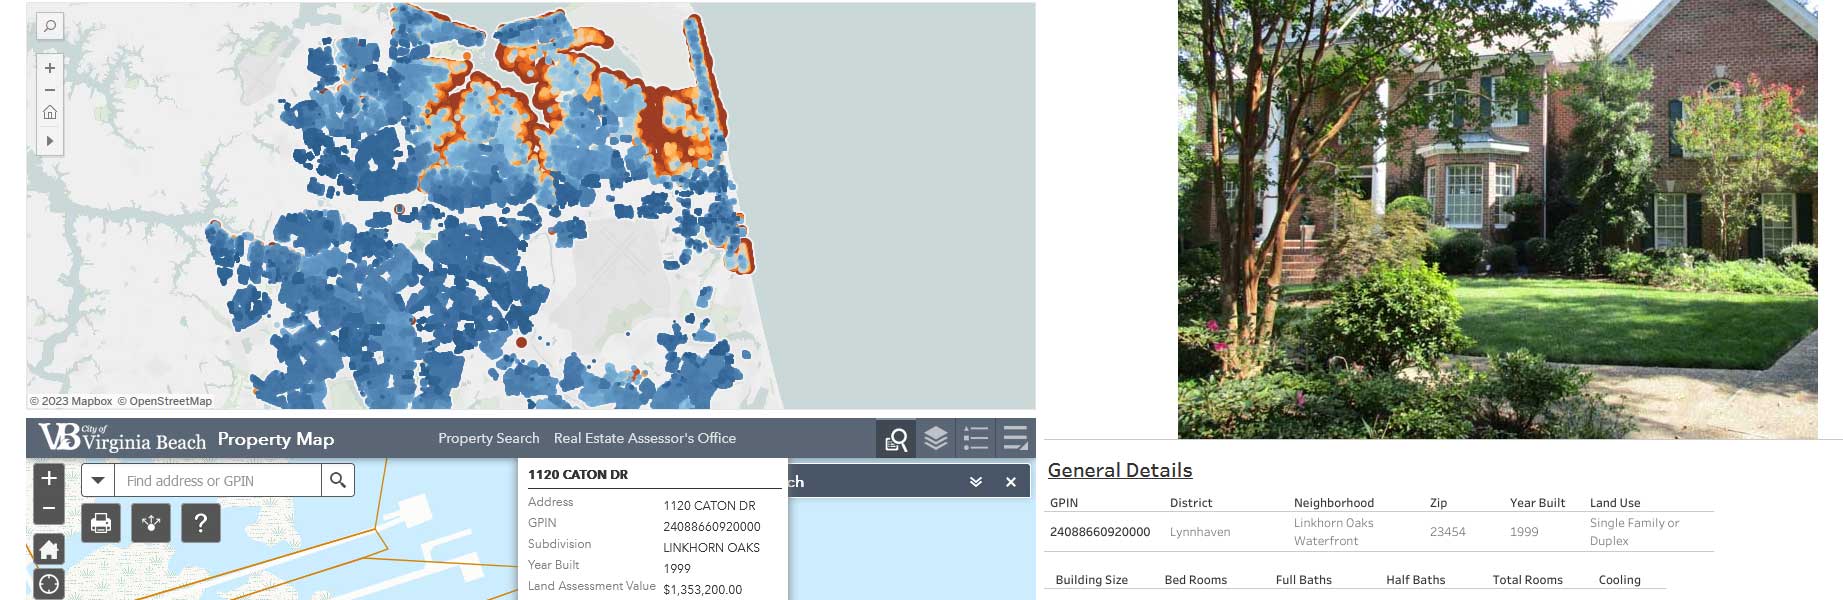
This is the visualization of the data aggregated by a Python based script. That project can be found here. Having gathered the relevant data, visualizing it is a good next step. The viz is meant to resemble the functionality of the VB Assessor's website. The major difference in functionality is that the appraisal heatmap shows the contrast of properties assessed from below $100K to above $1M.
The Tableau workbook includes the utilization of actions and parameters to update the image, table, plat PDF, and ESRI view. The ESRI view was is generated based on web request data captured at the VB site and passing the Tableau parameter as a GET variable to the workbook. The ESRI view and the Plat PDF file share the same container in Tableau which allows for dynamic display of files and web views.
In this Viz, the property details, plat URL link, images of the property, and ESRI view are dependent on a single value. In Tableau, a parameter can be across sheets and can also be used within a filter by setting a formula with the parameter as a control. The parameter in this Viz is named Select Address and serves as the control for the rest of the data. The parameter values are based on the Situs Street values that were gathered from a Python script. Here, the values are Fixed since I do not intend to update the list.
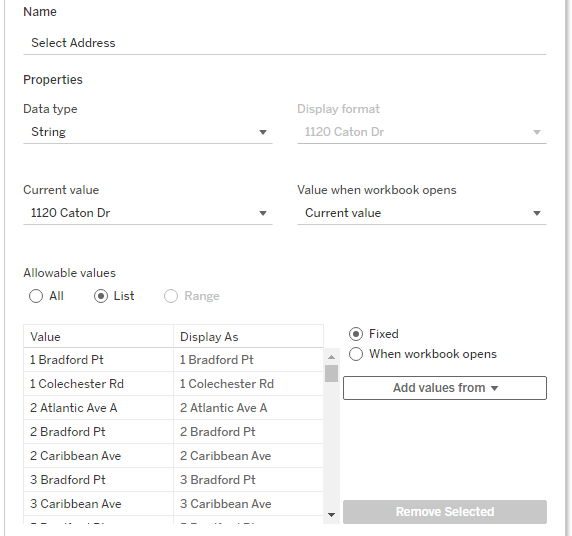
The filter is called Address and sets a condition by formula where the Select Address parameter is equal to the Address. Effectively, this limits the data returned to the single property that matches the parameter value. The data source for the sheet has unique values for the Address, therefore only one property is returned at a time.
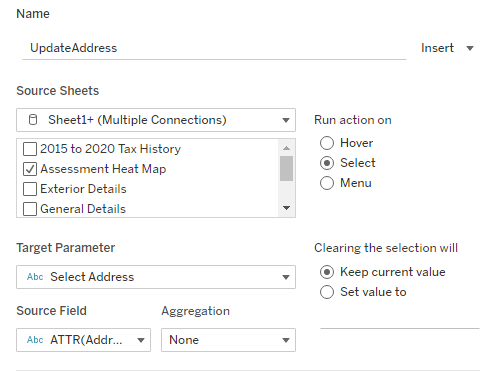
To update the property details, the Select Address parameter needs to change when selecting an address on the Heat Map. Adding a Parameter Action based on the Address field of the Heat Map updates the Select Address parameter. That, in turn, updates the filter of all the sheets using the conditional formula. The result is each sheet displayed in the Dashboard reflects the data specific to the address selected in the Heat Map.
In the dashboard, the ESRI view is loaded by modifying the GET parameters of the URL called by the Virginia Beach Assessor's site. Specifically, the GPIN needs to be pass as the GET variable to the URL.
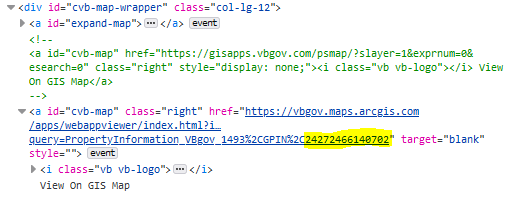
To accomplish this, a URL Action is attached to the Web Page Object. Since the Heat Map uses the GPIN as a field, it can be passed into the URL.
