
This project was a lot of fun. The goal was to put together a script that would retrieve the Real Estate Assessments for residential buildings in Virginia Beach so that the data could be used later in a hedonic pricing analysis. But getting data from web sources can get messy. It can also be time consuming. The initial run-time for the original script was about 36 hours. Using a multithreaded approach cut the time down to about half an hour.
This project really made me rely on my previous experience with development and with my studies in parallel processing from my Computer Science degree. But it also made me frame the problem with analytics in mind. The end result would need to be used by a visualization tool (Tableau) and ultimately be used as part of a quantitative analysis for a pricing model. Aggregating the data, cleaning it, and transforming it for ingest were just the beginning. The pricing model can be found here.
Mark Gonzalez
15th December 2021
The first thing that needed to be done was to aggregate the listings of occupied residential buildings in Virginia Beach. At the time of the project, there were 148,640 properties listed. Virginia Beach offers Open Data sets provided through their website. Initially, I thought I could use this site but that would have been too convenient. The property listing file provided in the Open Data set has all the properties listed in rows, but the number of fields provided (15 total) was limited in scope and could not be queried. I also attempted to retrieve a full dataset was through Zillow.com’s API but gaining access could not be established through their request process. I eventually decided to get tactical and just use the raw web requests to the Virginia Beach property listings to gain access the JSON files associated with their search listing pages at https://www.vbgov.com/property-search.
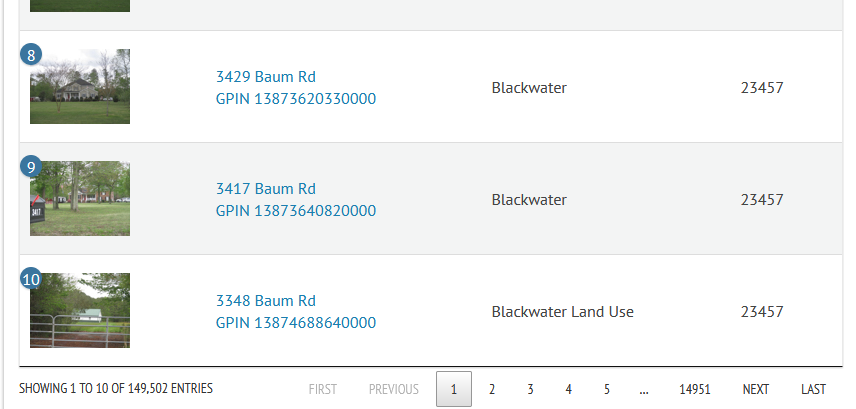
I noticed that, by default, the Property Search returned 10 listings at a time and performed pagination for the remaining listings.
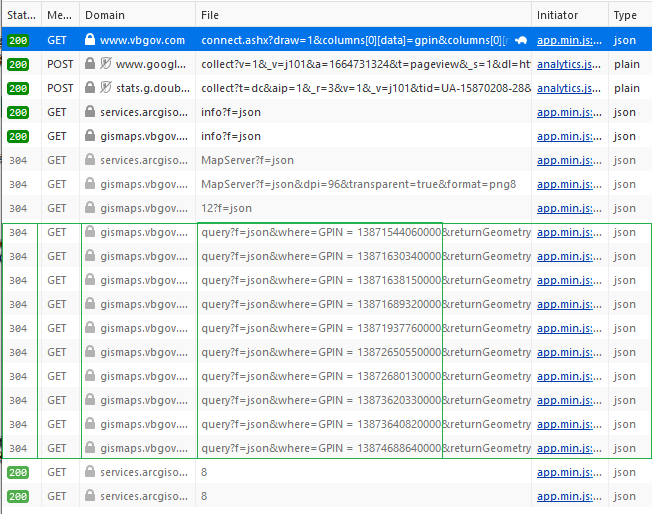
As I watched the network traffic, it became clear that AJAX calls were being used to retrieve JSON objects via GET requests. The primary request originated from the connect.ashx file and the GPINS were being used to identify each property listing object.
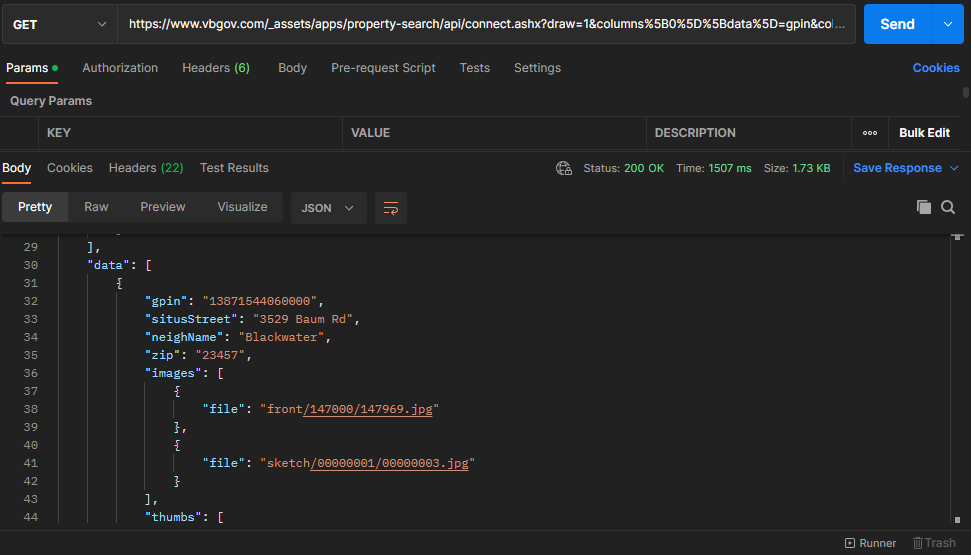
Using Postman, I was able to see the JSON object and determine that the property results were being placed within an element called “data”.
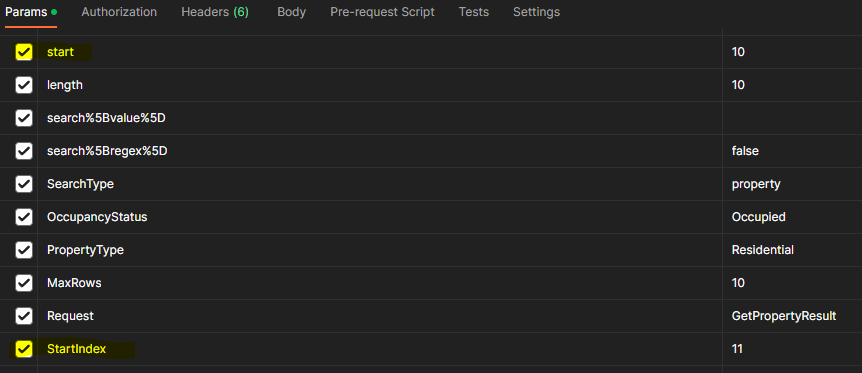
As navigation across the pagination buttons occurred, the draw, start, and StartIndex parameters changed. The “draw” parameter only refers to the number of times a pagination button is clicked. The “start” parameter refers to what index the pagination begins with based on the default number of listings to show. The indexes for the listing begins at 0, and every pagination after the first result set has a GET request with a start parameter that is a multiple of 10 because that is what the default number of listings is set to. Similarly, the StartIndex is the index of the first listing on the pagination and refers to the property index with regard to the entire listing.
Now that I understood how the web requests were formed, I could use Python to fetch the JSON objects returned by the Property Search page and save those objects as JSON files on my local hard drive. Each file starts with "listing" followed by a number corresponding to the draw it was retrieved on.
import requests

# Select what page to start on. Pagination uses draw to label page
draw = 1
# Start of page listing
start = (draw - 1) * 10
# Which house to start on
startIndex = start + 1

# TODO: Use returnsTotal from JSON object to set while sentinel
# Build the parameters
while draw < 14865:
    p = {
        'draw':draw,'columns%5B0%5D%5Bdata%5D':'gpin',
        "columns%5B0%5D%5Bname%5D":'',
        "columns%5B0%5D%5Bsearchable%5D":"true",
        "columns%5B0%5D%5Borderable%5D":"false",
        "columns%5B0%5D%5Bsearch%5D%5Bvalue%5D":"",
        "columns%5B0%5D%5Bsearch%5D%5Bregex%5D":"false",
        "columns%5B1%5D%5Bdata%5D":"situsStreet",
        "columns%5B1%5D%5Bname%5D":"",
        "columns%5B1%5D%5Bsearchable%5D":"true",
        "columns%5B1%5D%5Borderable%5D":"false",
        "columns%5B1%5D%5Bsearch%5D%5Bvalue%5D":"",
        "columns%5B1%5D%5Bsearch%5D%5Bregex%5D":"false",
        "columns%5B2%5D%5Bdata%5D":"neighName",
        "columns%5B2%5D%5Bname%5D":"",
        "columns%5B2%5D%5Bsearchable%5D":"true",
        "columns%5B2%5D%5Borderable%5D":"false",
        "columns%5B2%5D%5Bsearch%5D%5Bvalue%5D":"",
        "columns%5B2%5D%5Bsearch%5D%5Bregex%5D":"false",
        "columns%5B3%5D%5Bdata%5D":"zip",
        "columns%5B3%5D%5Bname%5D":"",
        "columns%5B3%5D%5Bsearchable%5D":"true",
        "columns%5B3%5D%5Borderable%5D":"false",
        "columns%5B3%5D%5Bsearch%5D%5Bvalue%5D":"",
        "columns%5B3%5D%5Bsearch%5D%5Bregex%5D":"false",
        "start":start,
        "length":10,
        "search%5Bvalue%5D":"",
        "search%5Bregex%5D":"false",
        "SearchType":"property",
        "OccupancyStatus":"Occupied",
        "PropertyType":"Residential",
        "MaxRows":10,
        "Request":"GetPropertyResult",
        "StartIndex":startIndex,
        "_":1603946025526}
    # Create the request URL with parameters set
    receive = requests.get("https://www.vbgov.com/_assets/apps/property-search/api/connect.ashx", params=p)
    # Open the directory where we want to save the JSON files and use draw parameter to identify each file
    # The JSON file will have 10 listings inside the data element. The filename starts with "listing"
    with open(r'D:vbresidences\listing'+str(draw)+'.json', 'wb') as f:
        f.write(receive.content)
        f.close()
    # Move on to the next pagination
    draw += 1
    start += 10
    startIndex += 10
With the JSON files ready, I moved on to aggregating the listings into a single Excel workbook.
import json
import pandas as pd
from os.path import exists
filePath = "D:/vbresidences/listing";
df = pd.DataFrame(columns=("gpin", "situsStreet", "neighName", "zip"))
# start with an empty list
rows_list = []
startPage = 1
maxPage = 14864
while startPage <= maxPage:
if exists(filePath + str(startPage) + '.json'):
with open(filePath + str(startPage) + '.json') as f:
data = json.load(f)
for d in data['data']:
# new dictionary
dt1 = {}
# add the data
dt1.update({'gpin': d["gpin"]})
dt1.update({'situsStreet': d["situsStreet"]})
dt1.update({'neighName': d["neighName"]})
dt1.update({'zip': d['zip']})
# append dictionary to list
rows_list.append(dt1)
# close file
f.close()
# update for sentinel
startPage += 1
print(startPage)
# update dataframe with list
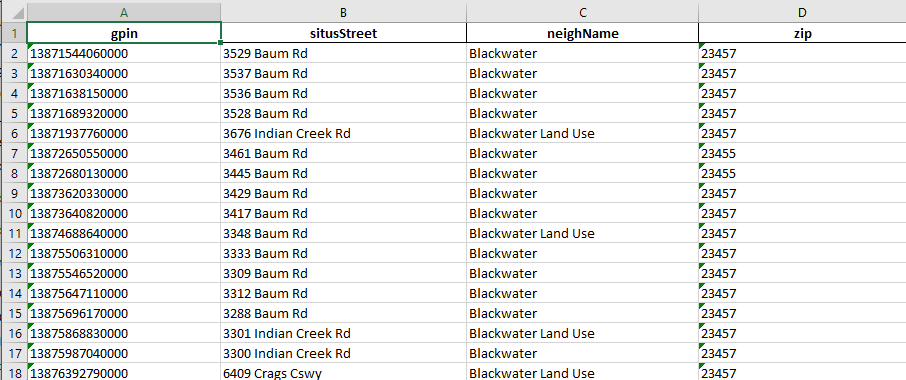
df = pd.DataFrame(rows_list)
# write data to excel file
with pd.ExcelWriter(filePath+'/vabeachlistings.xlsx') as writer:
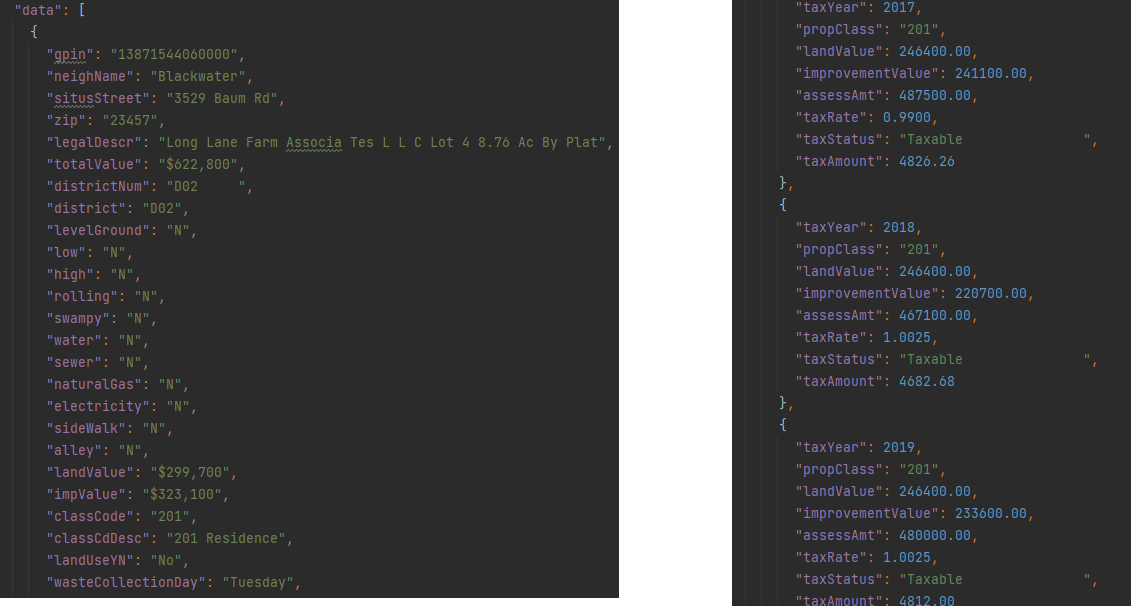
df.to_excel(writer, index=False)With all the listings aggregated into a single workbook, I used the GPIN of each property as a unique identifier and made web API requests to retrieve all the property field values available on the Assessor Property Search. Setting the request to GetPropertyDetail and providing a GPIN (Geographic Parcel Identification Number) I was able to retrieve details of each property in the Excel workbook I created. The listings Excel file looks like:
Each property can have hundreds of data points: including basic information about the property, zoning, home/land values, previous assessments, and taxable value. Again, the data element of the JSON holds the pertinent information about the property.
I leveraged Python’s ability to execute concurrent and asynchronous requests (concurrent.futures library) to reduce the I/O time to scrape all 148,864 property web pages. This significantly reduced the runtime of the script from 36 hours to about half an hour. Each property is saved as a JSON file labeled with its GPIN.
import concurrent.futures
import requests
import pandas as pd
import urllib.parse as urlparse
from urllib.parse import parse_qs


def build_url(gpins):
    urls = []
    url = 'https://www.vbgov.com/_assets/apps/property-search/api/connect.ashx?Request=GetPropertyDetail&gpin='
    for gpin in gpins:
        urls.append(url + str(gpin))
    return urls

# Retrieve a single page and return the contents
def load_url(url):
    receive = requests.get(url)
    return receive.content


# load the excel file
listings = pd.read_excel(r'D:\vbresidences\listing\vabeachlistings.xlsx')
df = pd.DataFrame(listings, columns=['gpin'])

print("Dataframe built")
# build gpin list
gpins = []
for k in df.index:
    gpins.append(df['gpin'][k])
print("GPINS in List")
# build the urls
URLS = build_url(gpins)
print("URLS built")

# empty list
row_list = []

count = 1
# We can use a with statement to ensure threads are cleaned up promptly
with concurrent.futures.ThreadPoolExecutor() as executor:
    # Start the load operations and mark each future with its URL
    future_to_url = {executor.submit(load_url, url): url for url in URLS}
    for future in concurrent.futures.as_completed(future_to_url):
        url = future_to_url[future]
        parsed = urlparse.urlparse(url)
        localgpin = parse_qs(parsed.query)['gpin']
        try:
            data = future.result()
        except Exception as exc:
            print('%r generated an exception: %s' % (url, exc))
        else:
            # add to list
            row_list.append(data)
            print(count)
            count += 1
            with open(r'D:\vbresidences\listing\details\\' + localgpin[0] + '.json', 'wb') as f:
                f.write(data)
                f.close()

print("All done")
Before the data could be used by Tableau, the amount of data points needed to be reduced to scope. Memory and functional requirements dictate this. First, Excel has limitations on the number of rows (1,048,576) that it can store for any one file. With assessments occurring every year, the number of property details would be multiplied by the number of assessments performed. The data set ranges from 2008 to 2020. There would be about 1.7M rows of data. So, I decided to break the data up into a sheet that contains general property details.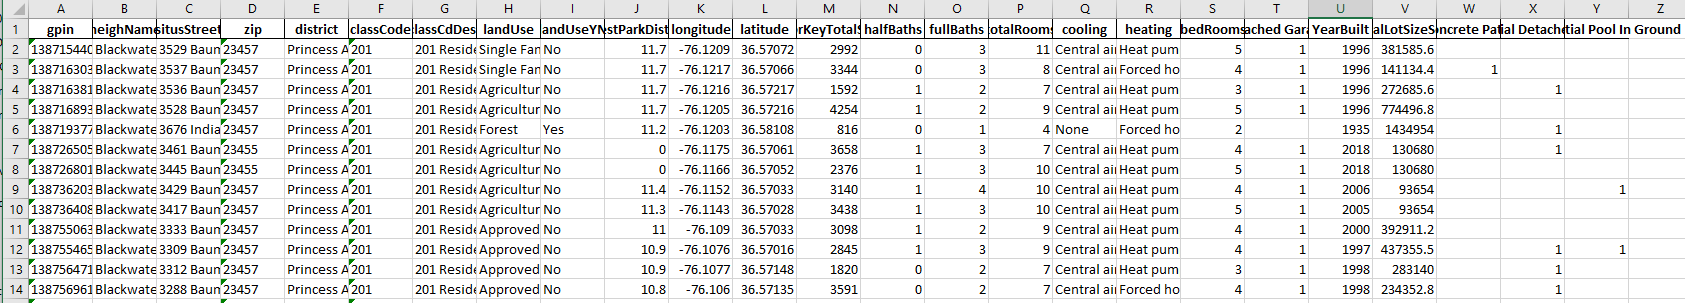
import json
import pandas as pd
# load the excel file to get gpins from
listings = pd.read_excel(r'vabeachlistings.xlsx')
# build dataframe
df = pd.DataFrame(listings, columns=['gpin'])
print("Dataframe built")
# build gpin list
gpins = []
for k in df.index:
gpins.append(df['gpin'][k])
gpins.sort()
print("GPINS in List")
count = 1
df = pd.DataFrame()
# list for the rows to be added to dataframe
row_list = []
for g in gpins:
# open the json file with the gpin of g
with open(r'listingdetails\\' + str(g) +'.json') as details_file:
data = json.load(details_file)
data_dt = {}
# Is there only one building on the property
buildingCount = len(data['data'][0]['buildings'])
if buildingCount == 1:
# Make sure a dwelling is present on the property
use_codes = []
# find improvements
for improvements in data['data'][0]['buildings'][0]['improvements']:
use_codes.append(improvements['useCode'])
dwelling_code = "DWELL" in use_codes
if dwelling_code == True:
# get the general data
data_dt.update({'gpin': data['data'][0]['gpin']})
data_dt.update({'neighName': data['data'][0]['neighName']})
data_dt.update({'situsStreet': data['data'][0]['situsStreet']})
data_dt.update({'zip': data['data'][0]['zip']})
data_dt.update({'district': data['data'][0]['district']})
data_dt.update({'classCode': data['data'][0]['classCode']})
data_dt.update({'classCdDesc': data['data'][0]['classCdDesc']})
# get geo information
data_dt.update({'longitude': data['data'][0]['longitude']})
data_dt.update({'latitude': data['data'][0]['latitude']})
# land use info
data_dt.update({'landUse': data['data'][0]['landUse']})
data_dt.update({'landUseYN': data['data'][0]['landUseYN']})
data_dt.update({'closestParkDistance': data['data'][0]['closestParkDistance']})
# Get the building details
for b in data['data'][0]['buildings']:
# Get the square footage of each level
for sq in b['squareFootages']:
# add floor sqft: Here, floor key is dynamically allocated
if sq['floorKey'] == "Total":
data_dt.update({'floorKeyTotalSqFt': sq['totalSqFt']})
# get the dwelling data
for dw in b['dwellings']:
data_dt.update({'halfBaths': dw['halfBaths']})
data_dt.update({'fullBaths': dw['fullBaths']})
data_dt.update({'totalRooms': dw['totalRooms']})
data_dt.update({'cooling': dw['cooling']})
data_dt.update({'heating': dw['heating']})
data_dt.update({'bedRooms': dw['bedRooms']})
# find exterior features
for extfeatures in b['extFeatures']:
if extfeatures['extFeatCode'] == 'CONCP':
data_dt.update({extfeatures['extFeatDesc']: 1})
# find improvements
for improvements in b['improvements']:
improvement_list = ['ATTGAR', 'DETGAR', 'POOL', 'DWELL']
if improvements['useCode'] in improvement_list:
if improvements['useCode'] == 'DWELL':
data_dt.update({'YearBuilt': improvements['constrYr']})
else:
data_dt.update({improvements['description']: 1})
# Get the land details
acres = 0;
for ld in data['data'][0]['landDetails']:
acres = ld['landAcres'] + acres
# Calculate Total land acreage in square feet
data_dt.update({'totalLotSizeSqFt': acres * 43560})
row_list.append(data_dt)
details_file.close()
# monitor progress
print(str(count) + " " + str(g))
count += 1
# update dataframe with list
df = pd.DataFrame(row_list)
# write data to excel file
with pd.ExcelWriter('propertydetails_with_coordinates.xlsx') as writer:
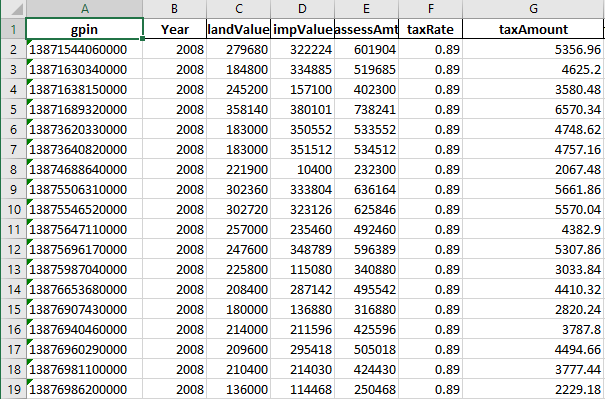
df.to_excel(writer, index=False)All appraisals were transformed into year-by-year breakdowns of unpivoted and unnested fields. These were saved as separate sheets labeled according to their year. Each row contains the GPIN corresponding to the property the appraisal belongs to. This way, the sheets could be joined by GPINs to the property detail sheet when used by other applications like SQL, Tableaus, or SAS.
import json
import pandas as pd

# load the excel file to get gpins from
listings = pd.read_excel(r'vabeachlistings.xlsx')

# build dataframe
df = pd.DataFrame(listings, columns=['gpin'])
print("Dataframe built")

# build gpin list
gpins = []
for k in df.index:
    gpins.append(df['gpin'][k])
gpins.sort()
print("GPINS in List")

count = 1

df = pd.DataFrame()
# list for the rows to be added to dataframe
row_list = []

for g in gpins:

    # open the json file with the gpin of g
    with open(r'listingdetails\\' + str(g) +'.json') as details_file:
        data = json.load(details_file)

        # Only get data from properties with one building
        if len(data['data'][0]['buildings']) < 2:
            # Get the appraisal history
            start_year = 2008
            end_year = 2020
            for tax_assessments in data['data'][0]['taxAssessAmts']:
                data_dt = {}
                if end_year >= tax_assessments['taxYear'] >= start_year:
                    print(str(count) + " " + str(g) + ' ' + str(start_year))
                    count += 1
                    # get the property gpin
                    data_dt.update({'gpin': data['data'][0]['gpin']})
                    data_dt.update({'Year': tax_assessments['taxYear']})
                    data_dt.update({'landValue': tax_assessments['landValue']})
                    data_dt.update({'impValue': tax_assessments['improvementValue']})
                    data_dt.update({'assessAmt': tax_assessments['assessAmt']})
                    data_dt.update({'taxRate': tax_assessments['taxRate']})
                    data_dt.update({'taxAmount': tax_assessments['taxAmount']})
                    # monitor progress
                    row_list.append(data_dt)
    details_file.close()
# update dataframe with list
df = pd.DataFrame(row_list)
# write data to excel file
with pd.ExcelWriter(str(start_year) + '_appraisals.xlsx') as writer:
    df.to_excel(writer, index=False)
Source Code for the project is publicly available at my GitHub:
GitHub: https://github.com/mindfullofit/vbRealEstateScraping.git
Virginia Beach Real Estate Assessor's Website:
https://www.vbgov.com/property-search